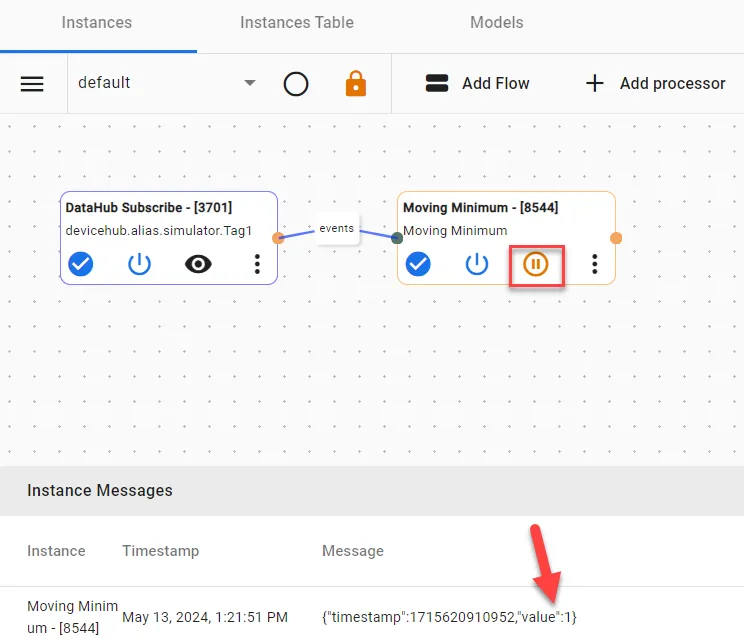
Use the Moving Window Processor Function
You can use a single input to perform calculations over a sliding or moving window of data from your PLC device. Single inputs are to be provided with the events-type connection and then the respective functions are calculated as the names suggest.
Understanding Different Moving Window Functions
Use one of the following functions for your inputs:
- Moving Average: Calculates the average of the moving window of input values in the Flow.
- Moving Maximum: Returns the maximum value among the moving window of input values in the Flow.
- Moving Minimum: Returns the minimum value among the moving window of input values in the Flow.
User Scenario
Review the following scenario for the moving window processor function. Then, you will simulate PLC data and calculate KPIs using multiple moving processor functions.
In a production facility, several PLCs use multiple sensors to monitor parameters such as temperature, pressure, and speed.
- You can monitor temperature trends and detect anomalies in machines by using the Moving Average function over a specific time frame.
- You can identify any sudden spikes by extracting the highest pressure readings from sensors using the Moving Maximum function over a specific time frame.
- You can pinpoint periods when machine performance drops below acceptable levels by using the Moving Minimum function within a defined window.
Step 1: Add a Device
Follow the steps to Connect a Device and configure the following parameters:
- Device Type: Simulator
- Driver Name: Generator
- Enable Alias Topics: Select the checkbox.
Step 2: Add Tags
After connecting the device, add the following tags. See Add Tags to learn more. Only one tag will be used for simulating the different Moving processor outputs mentioned above.
Tag 1: tag1
- Name: Select S - Random value generator
- Value Type: Select float64
- Polling Interval: Enter 5
- Tag Name: Enter tag1
- Min_value: Enter 1
- Max_value: Enter 99
Step 3: Create Analytics Flows
You can now create the analytics flows using data from the device and tag you previously created. Follow the appropriate step out of 3a, 3b, or, 3c based on the Moving Window Processor Function you want to use.
To create an analytics flow with the Moving Window Processor function:
- Navigate to Analytics.
On the analytics canvas, click Add processor. The Create a processor dialog box displays.
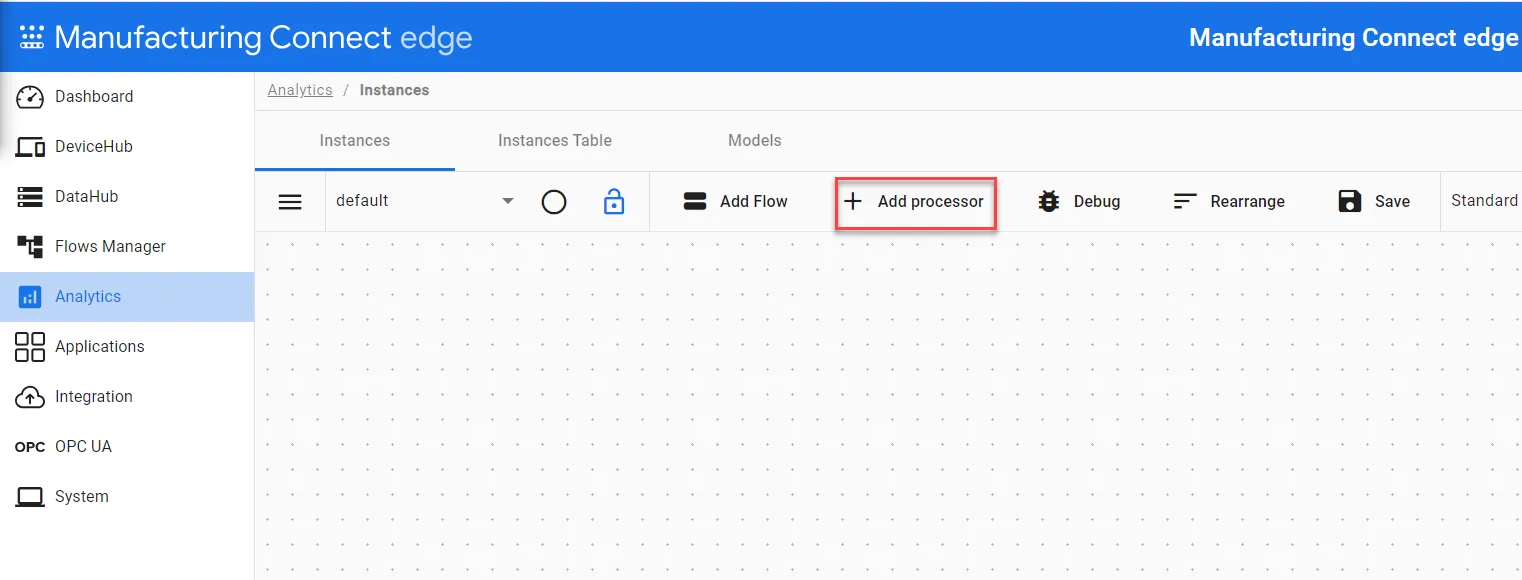 The Add processor option
- Select DataHub Subscribe.
In the Topic field, click the Search icon, select the device you previously created, and then select the alias topic for the tag1.
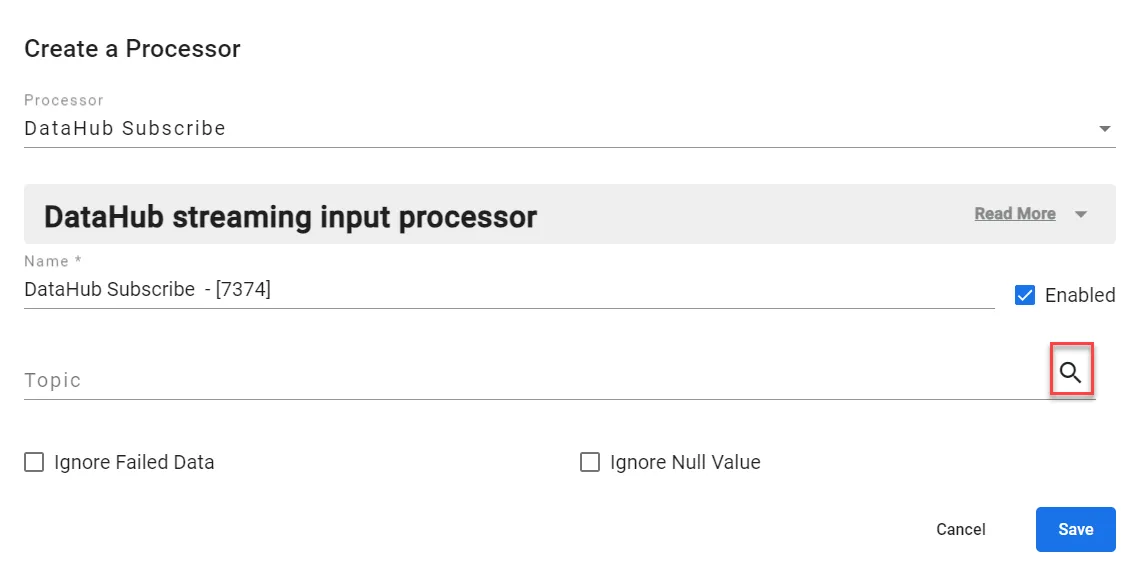 Create a Processor dialog box
- Click Save.
Step 3a: Configure Moving Average Processor
- Click Add processor again and select Moving Average. The following information defines this function:
- Field Name: Select the field name for which you want to apply the function. For example, value or downtime.
- Processing Type: Select float from the drop-down list.
- Window Size: Enter the number of values you want the function to consider.
Click Save.
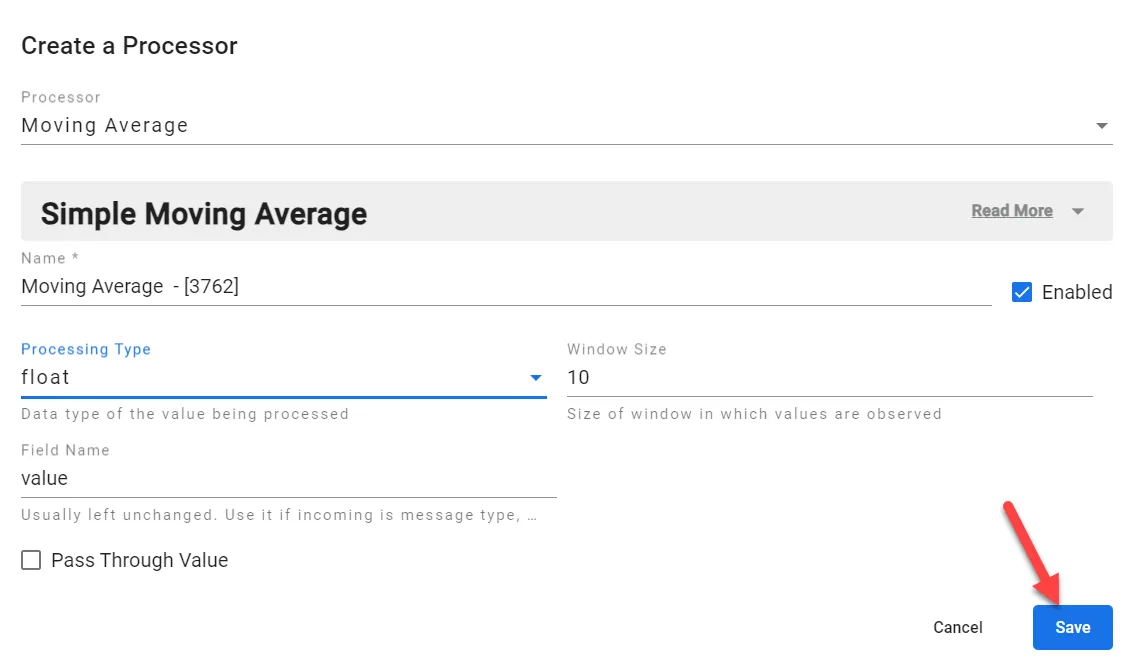 Moving Average dialog box
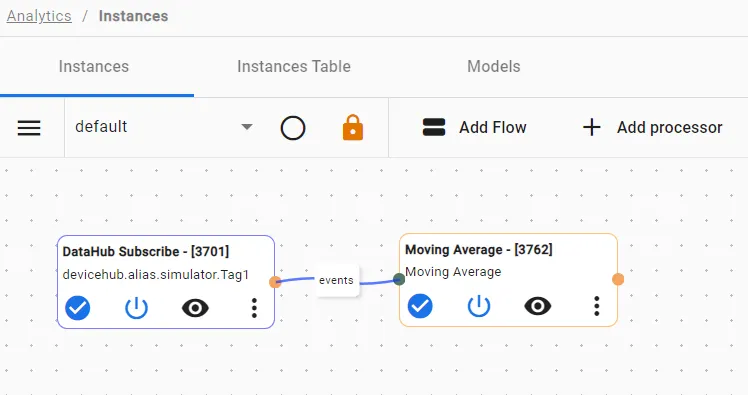
- Connect the DataHub Subscribe processor (tag: tag1) to the Moving Average processor with a wire and use the events connection.
- On the analytics canvas, click Save.
The configured analytics flows should look like the following:
Step 3b: Configure Moving Maximum Processor
- Click Add processor again and select Moving Maximum. The following information defines this function:
- Field Name: Select the field name for which you want to apply the function. For example, value or downtime.
- Processing Type: Select float from the drop-down list.
- Window Size: Enter the number of values you want the function to consider.
Click Save.
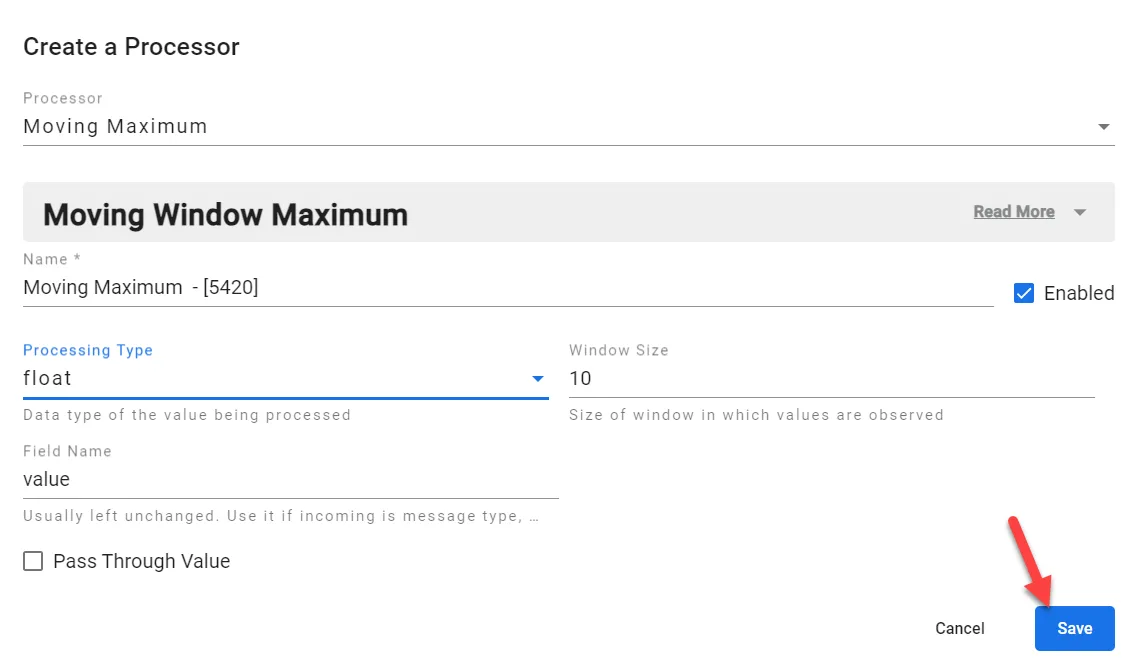 Moving Maximum dialog box
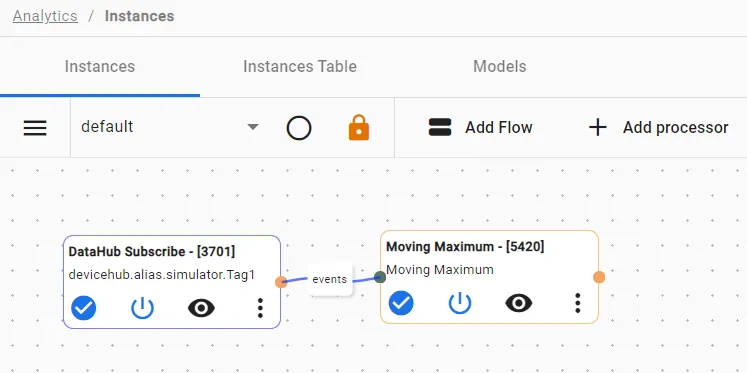
- Connect the DataHub Subscribe processor (tag: tag1) to the Moving Maximum processor with a wire and use the events connection.
- On the analytics canvas, click Save.
The configured analytics flows should look like the following:
Step 3c: Configure Moving Minimum Processor
- Click Add processor again and select Moving Minimum. The following information defines this function:
- Field Name: Select the field name for which you want to apply the function. For example, value or downtime.
- Processing Type: Select float from the drop-down list.
- Window Size: Enter the number of values you want the function to consider.
Click Save.
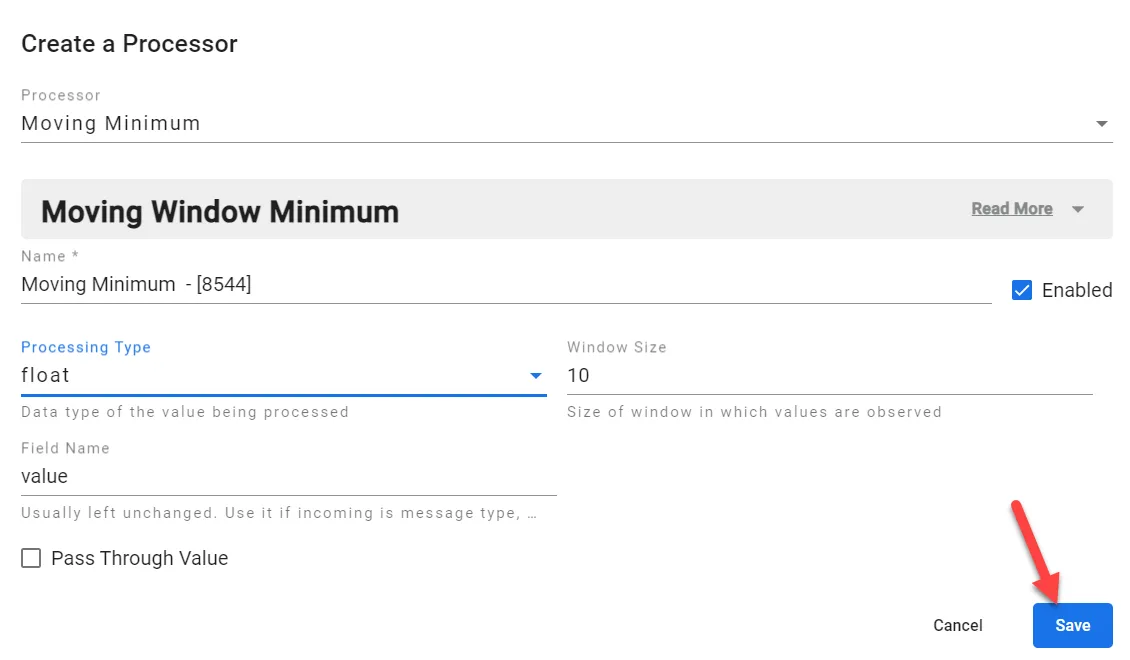 Moving Minimum dialog box
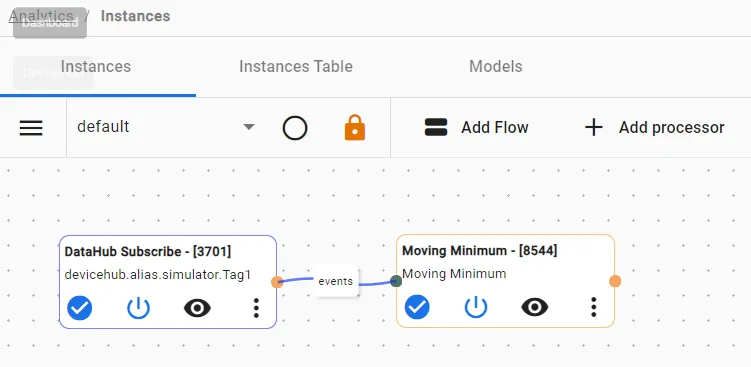
- Connect the DataHub Subscribe processor (tag: tag1) to the Moving Minimum processor with a wire and use the events connection.
- On the analytics canvas, click Save.
The configured analytics flows should look like the following:
Step 4: View Output of Processor
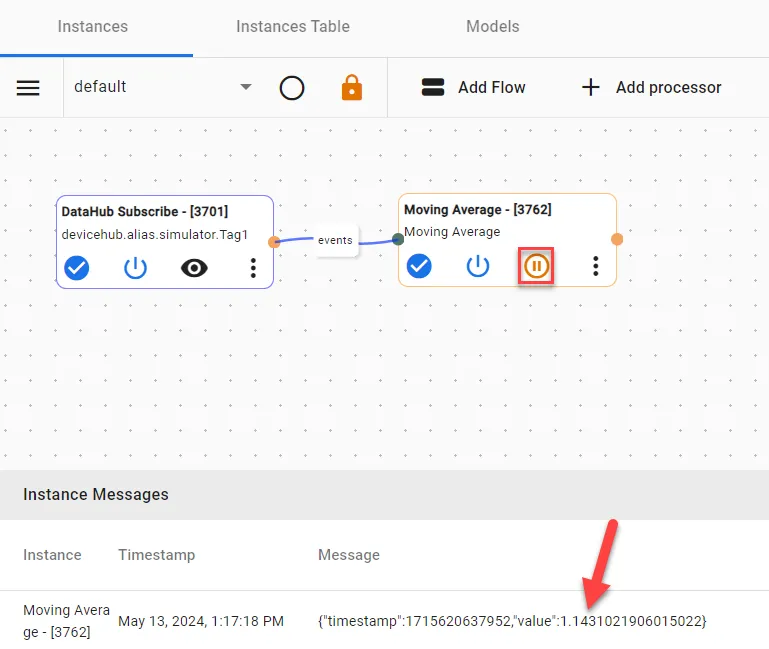
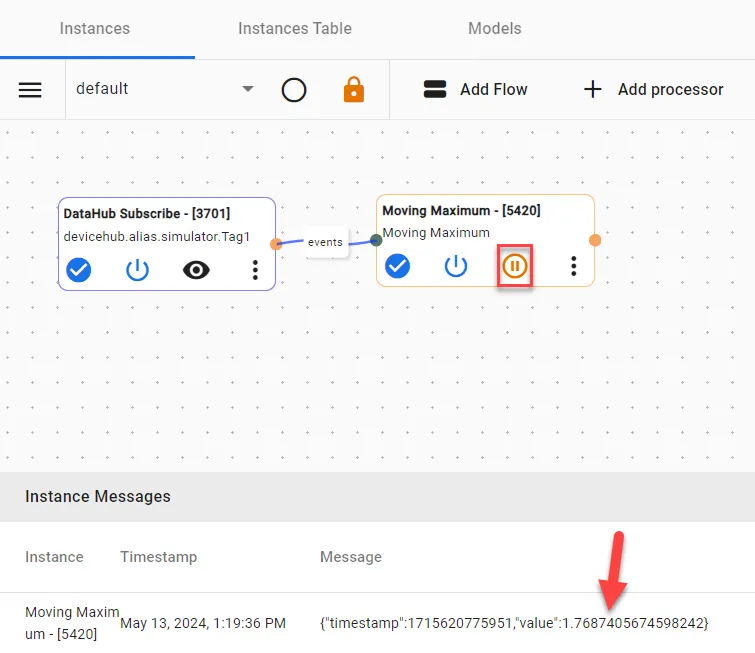
Click the View icon in the Moving processor to view the output values.
View Moving Average Output
The average function calculates the average of last 10 values from the defined tag1 values.
View Moving Maximum Output
The maximum function finds the largest of last 10 values from the defined tag1 values.
View Moving Minimum Output
The minimum function finds the smallest of last 10 values from the defined tag1 values.